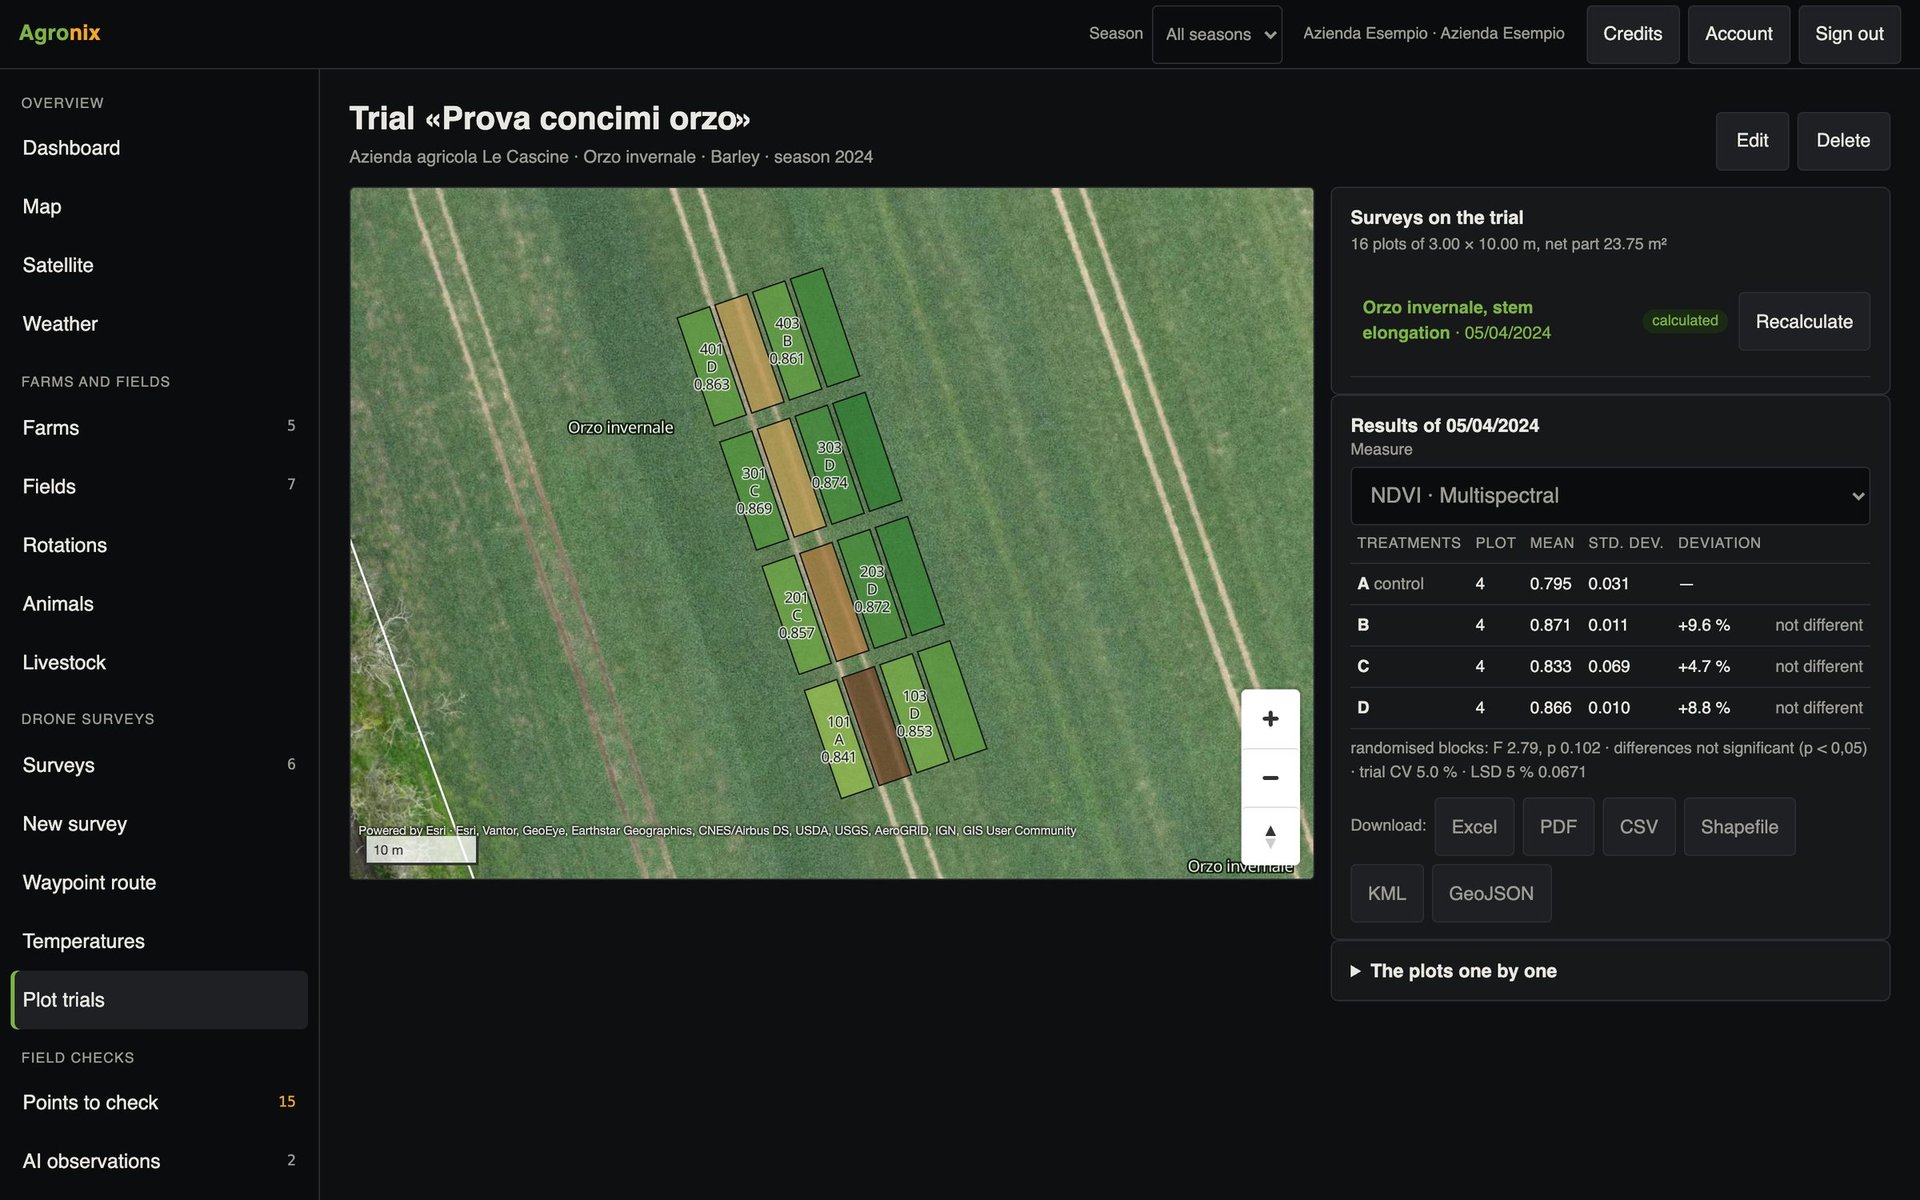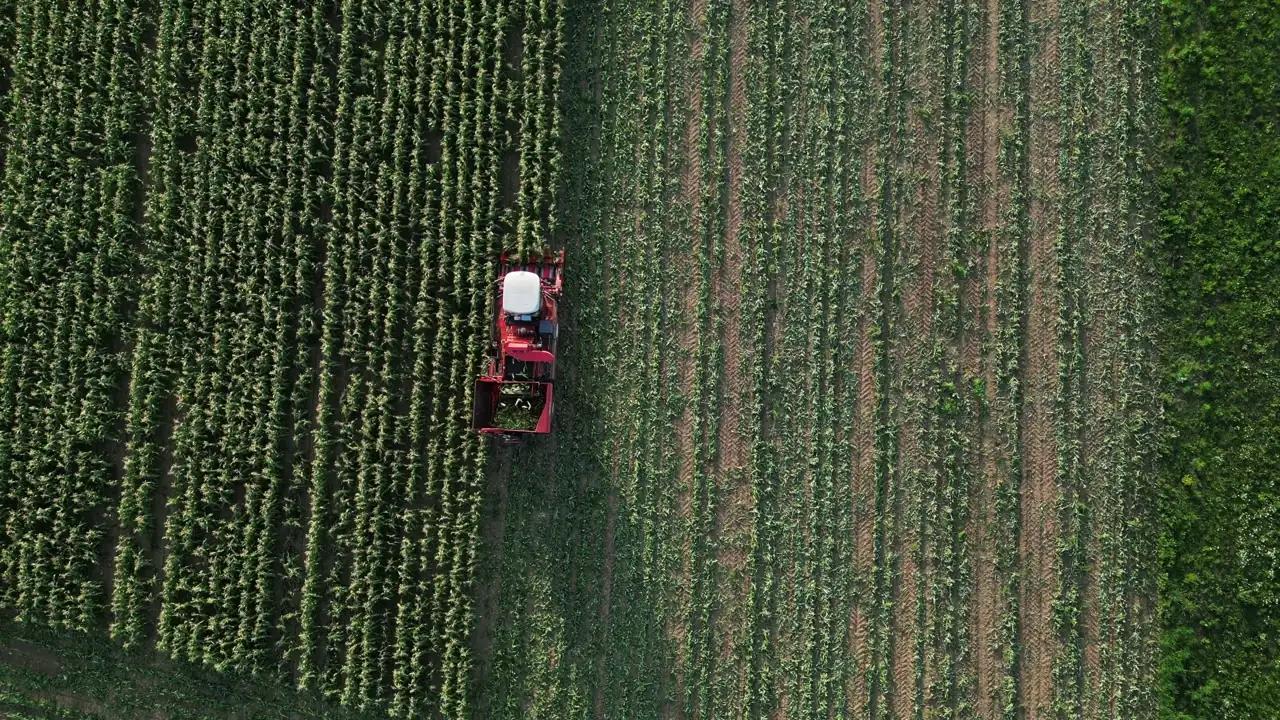
Count plants and weeds from the flight photos
Plant density and emergence compared with sowing; a weed map of the whole field, the basis for spot weeding.
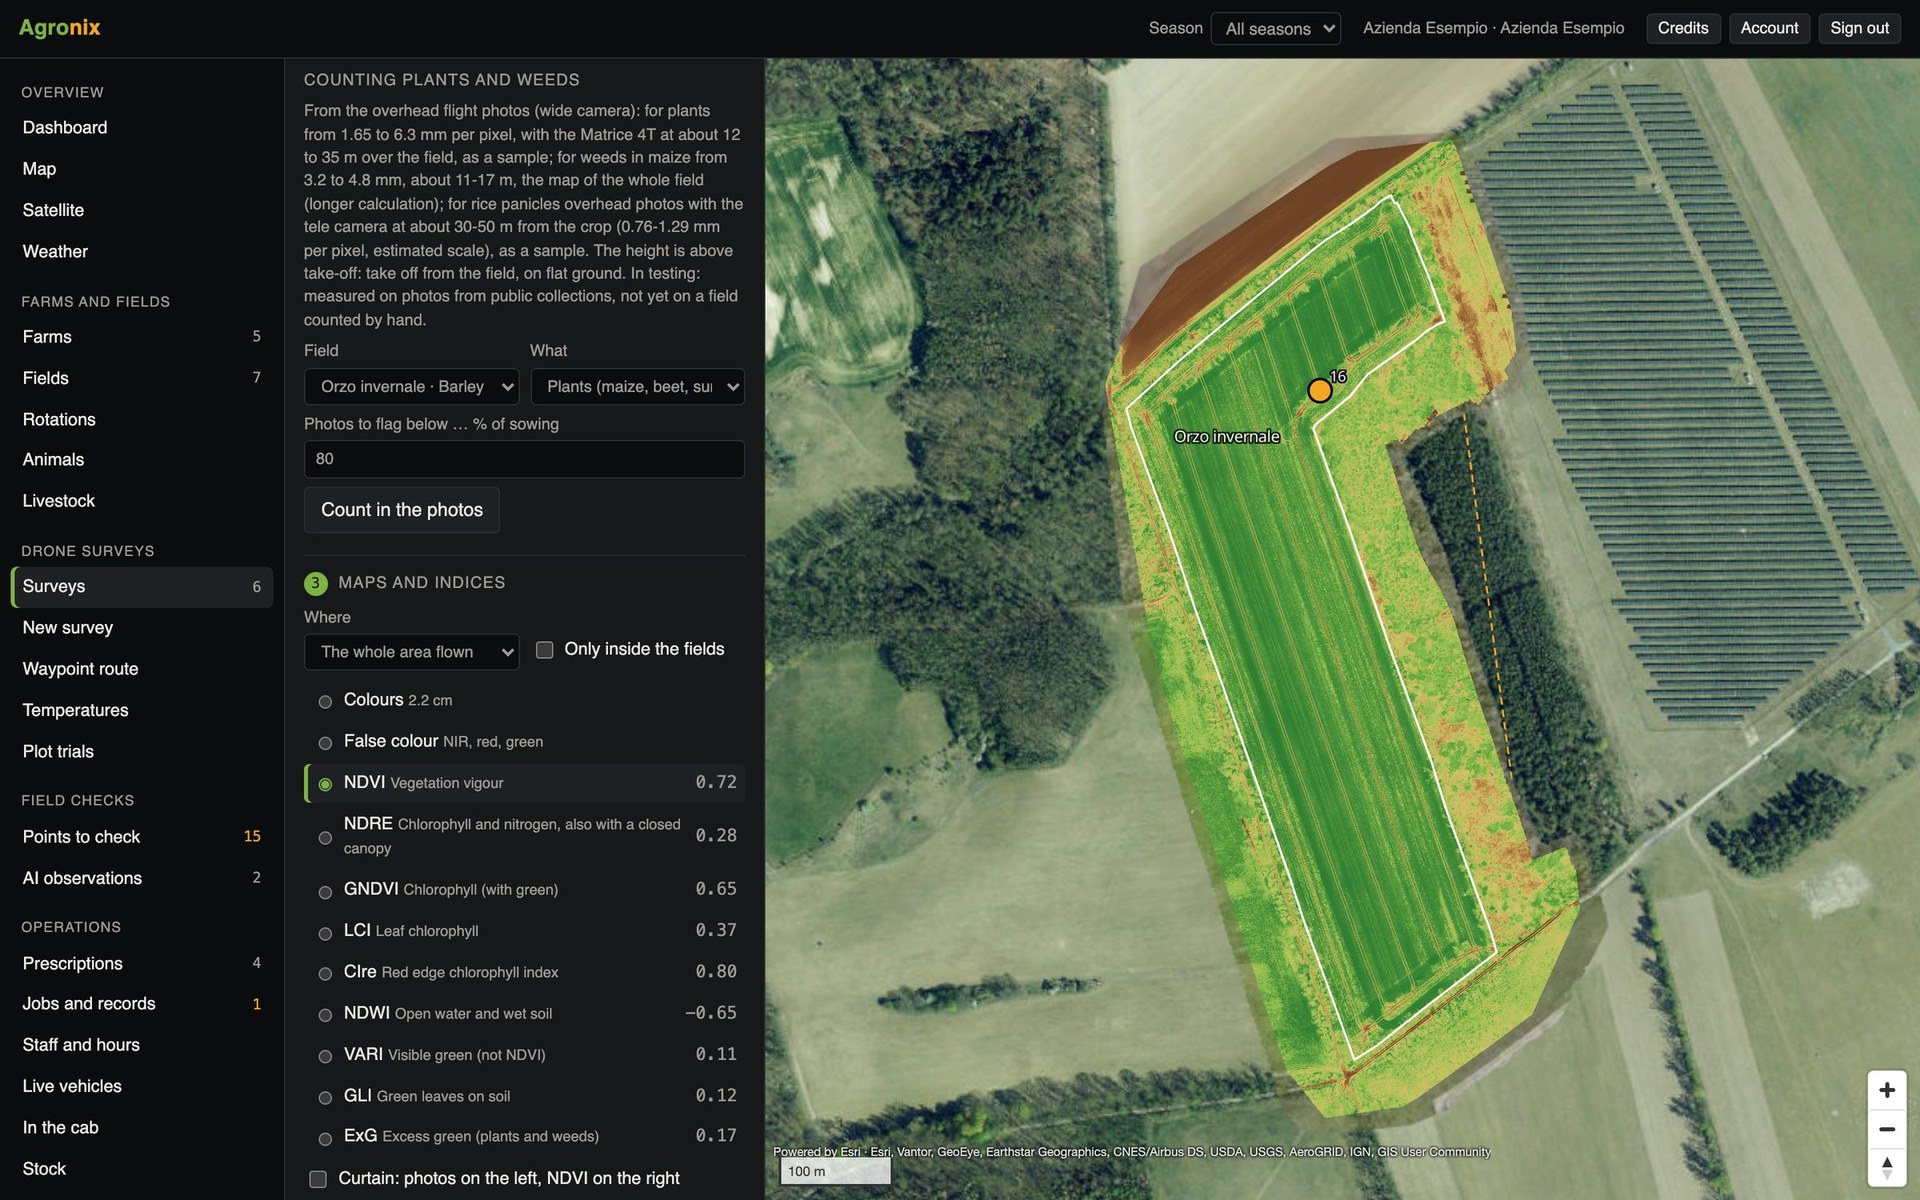
Counting plants by hand on a few square metres gives an uncertain estimate. Agronix analyses the flight photos, not the orthomosaic, to keep the detail: it finds each plant or weed, calculates the density and compares it with the recorded sowing.
Plants
Measure density and emergence
Agronix selects a sample of nadir photos at the right scale and entirely inside the field, counts the plants and estimates the density with its confidence interval. Compared with the sowing in the records, density becomes an emergence percentage; on the map the sample photos are coloured by density.
- Density with a 95 % interval
- Emergence compared with sowing
- Clips for visual checking
Weeds
Map the weeds, treat only where needed
For weeds Agronix uses every useful photo and maps each plant on the ground in one-metre cells, without counting it twice where photos overlap. The map gives the «On the weeds» prescription, with a margin around each cell.
- Map in 1 m cells
- No double counting
- Spot-weeding prescription
How to use it
- 1
Fly low
Plants need a few millimetres per pixel.
- 2
Start the count
From the survey page, for one field.
- 3
Check the clips
Plants and weeds boxed on the photos.
- 4
Use the results
Emergence, map and prescription.
Specifications
- Plant check
- On test photos the model had never seen: F1 0.80, count −8 %.
- Weed check
- F1 0.80 on test photos.
- Scale
- Plants between 1.65 and 6.3 mm per pixel: with the Matrice 4T, about 12-35 m altitude.
- Rice panicles
- Count per m² from the telephoto lens, being tested.
The count is a statistical estimate on the sample of photos: the interval shown measures its uncertainty.
Related features
- Prescription mapsVariable-rate fertiliser, seeding, plant protection and spot weeding, in six guided steps.Learn more
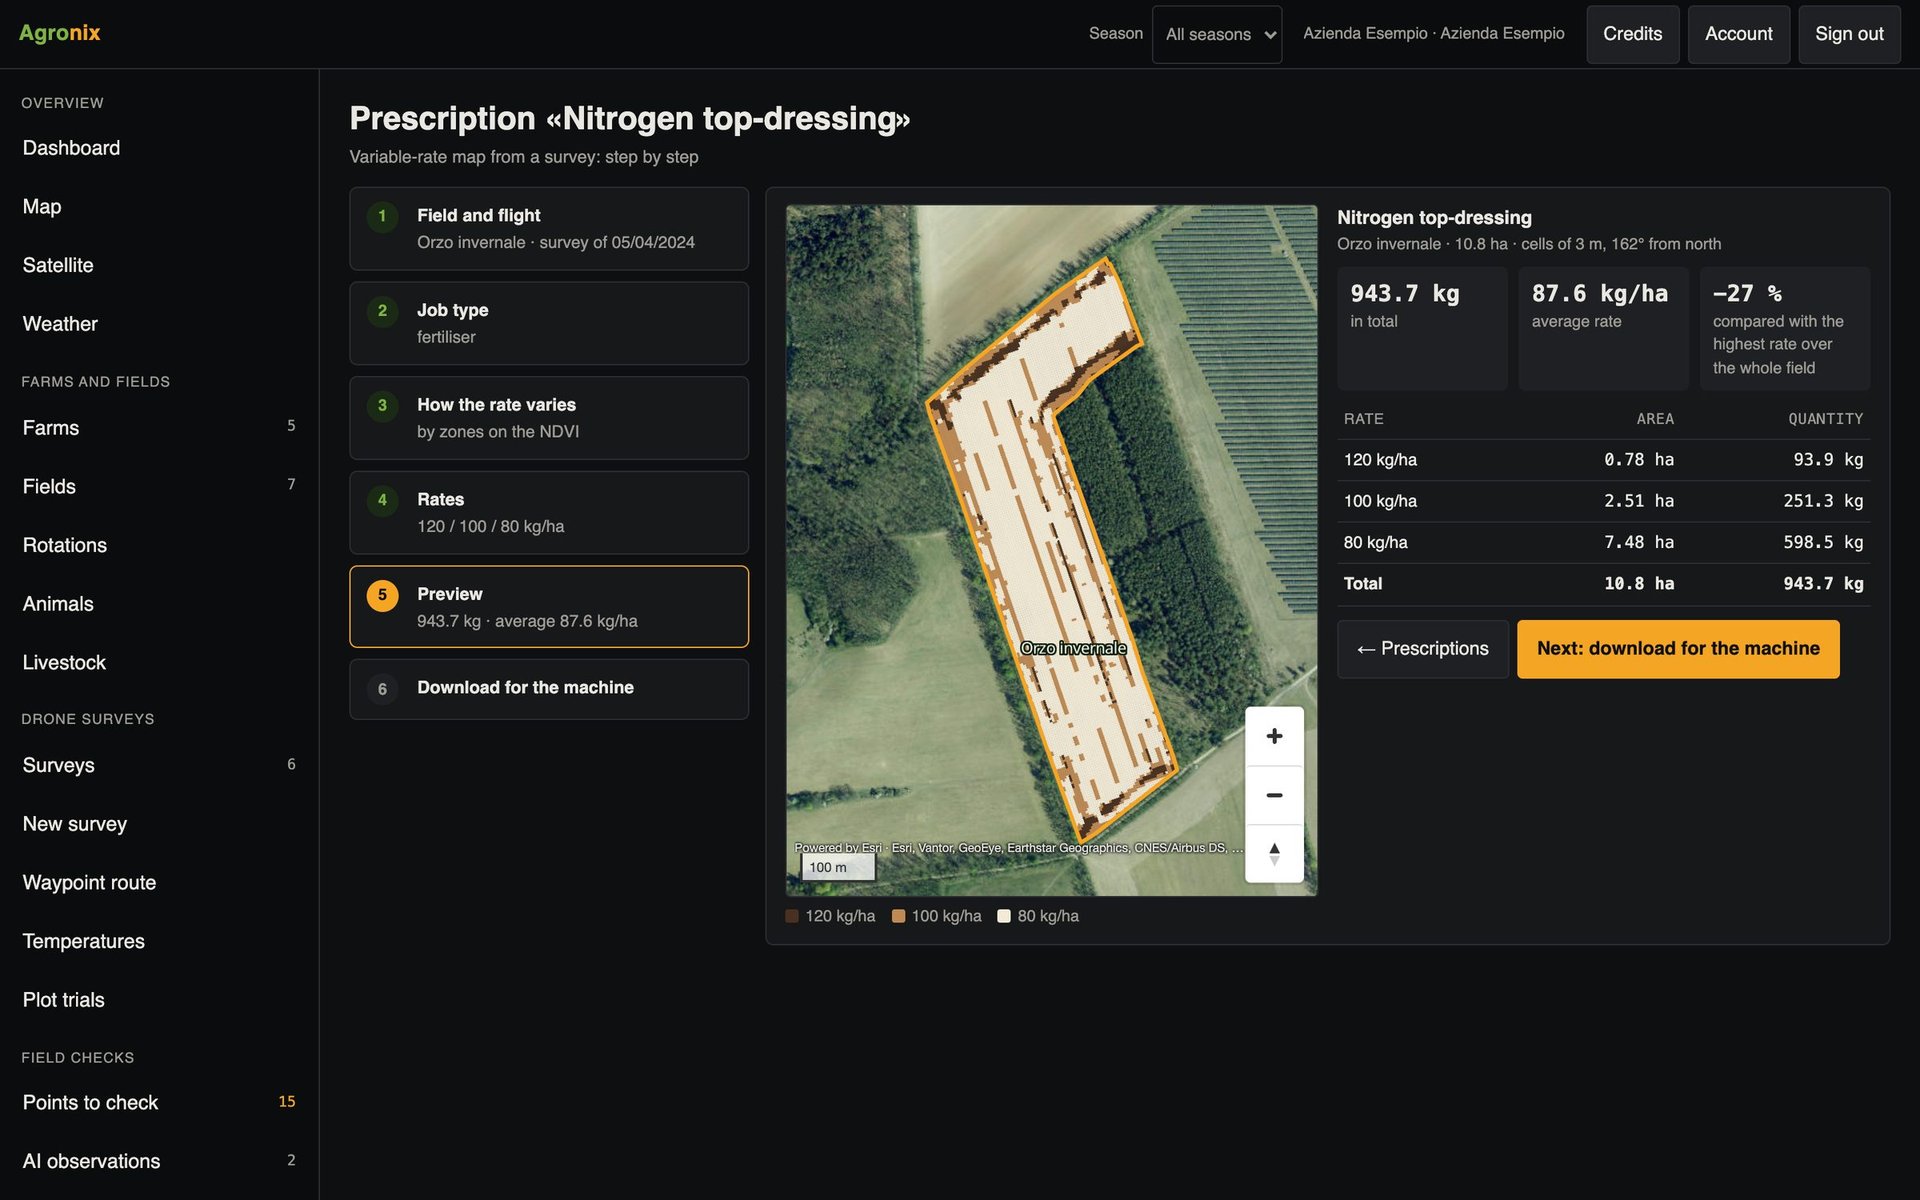
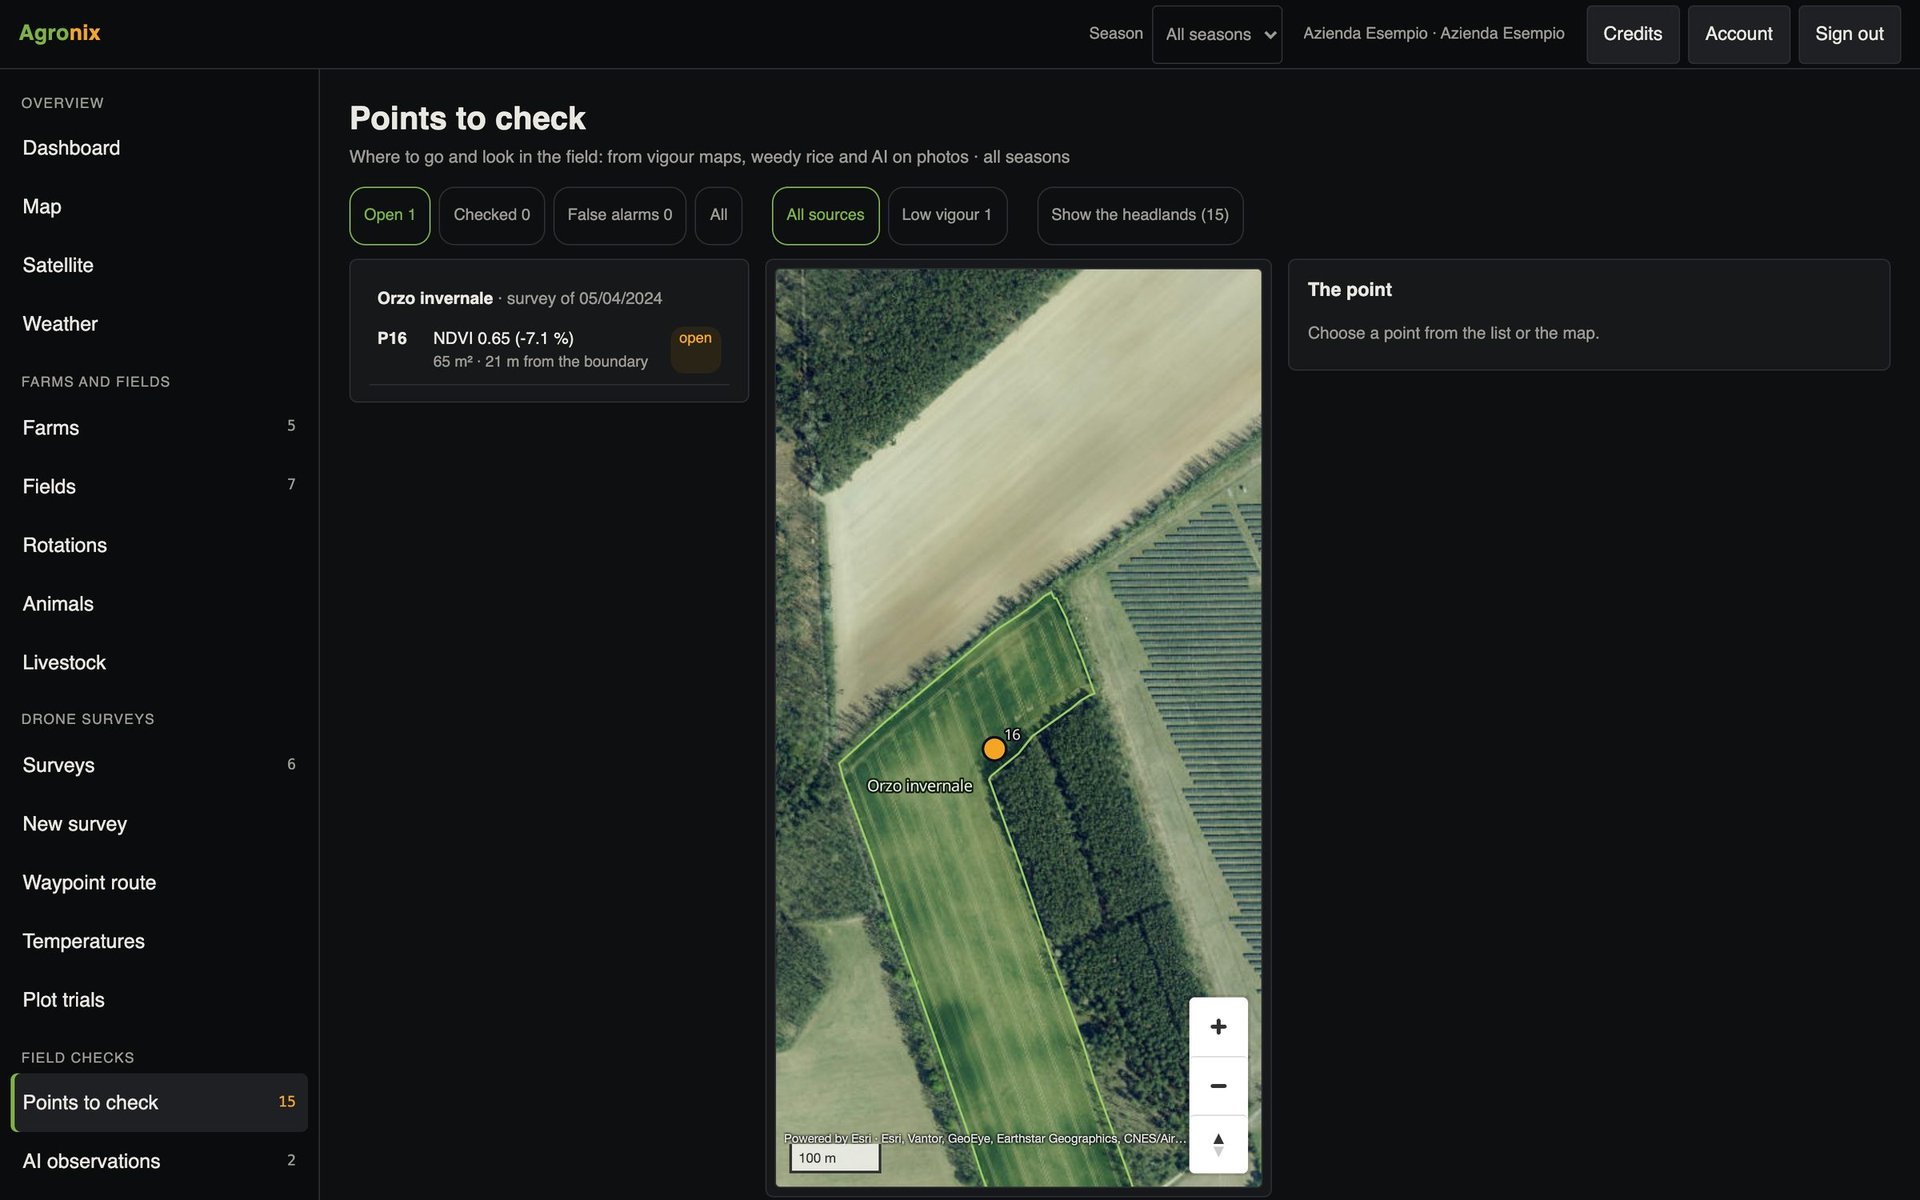
- Points to checkMaps find the critical areas; «Take me here» guides the operator to the spot.Learn more
- Plot trialsPlots on the map, data for each plot at every survey, analysis of variance between treatments.Learn more